Hypertrace Dashboard
 |
|---|
| Hypertrace Dashboard |
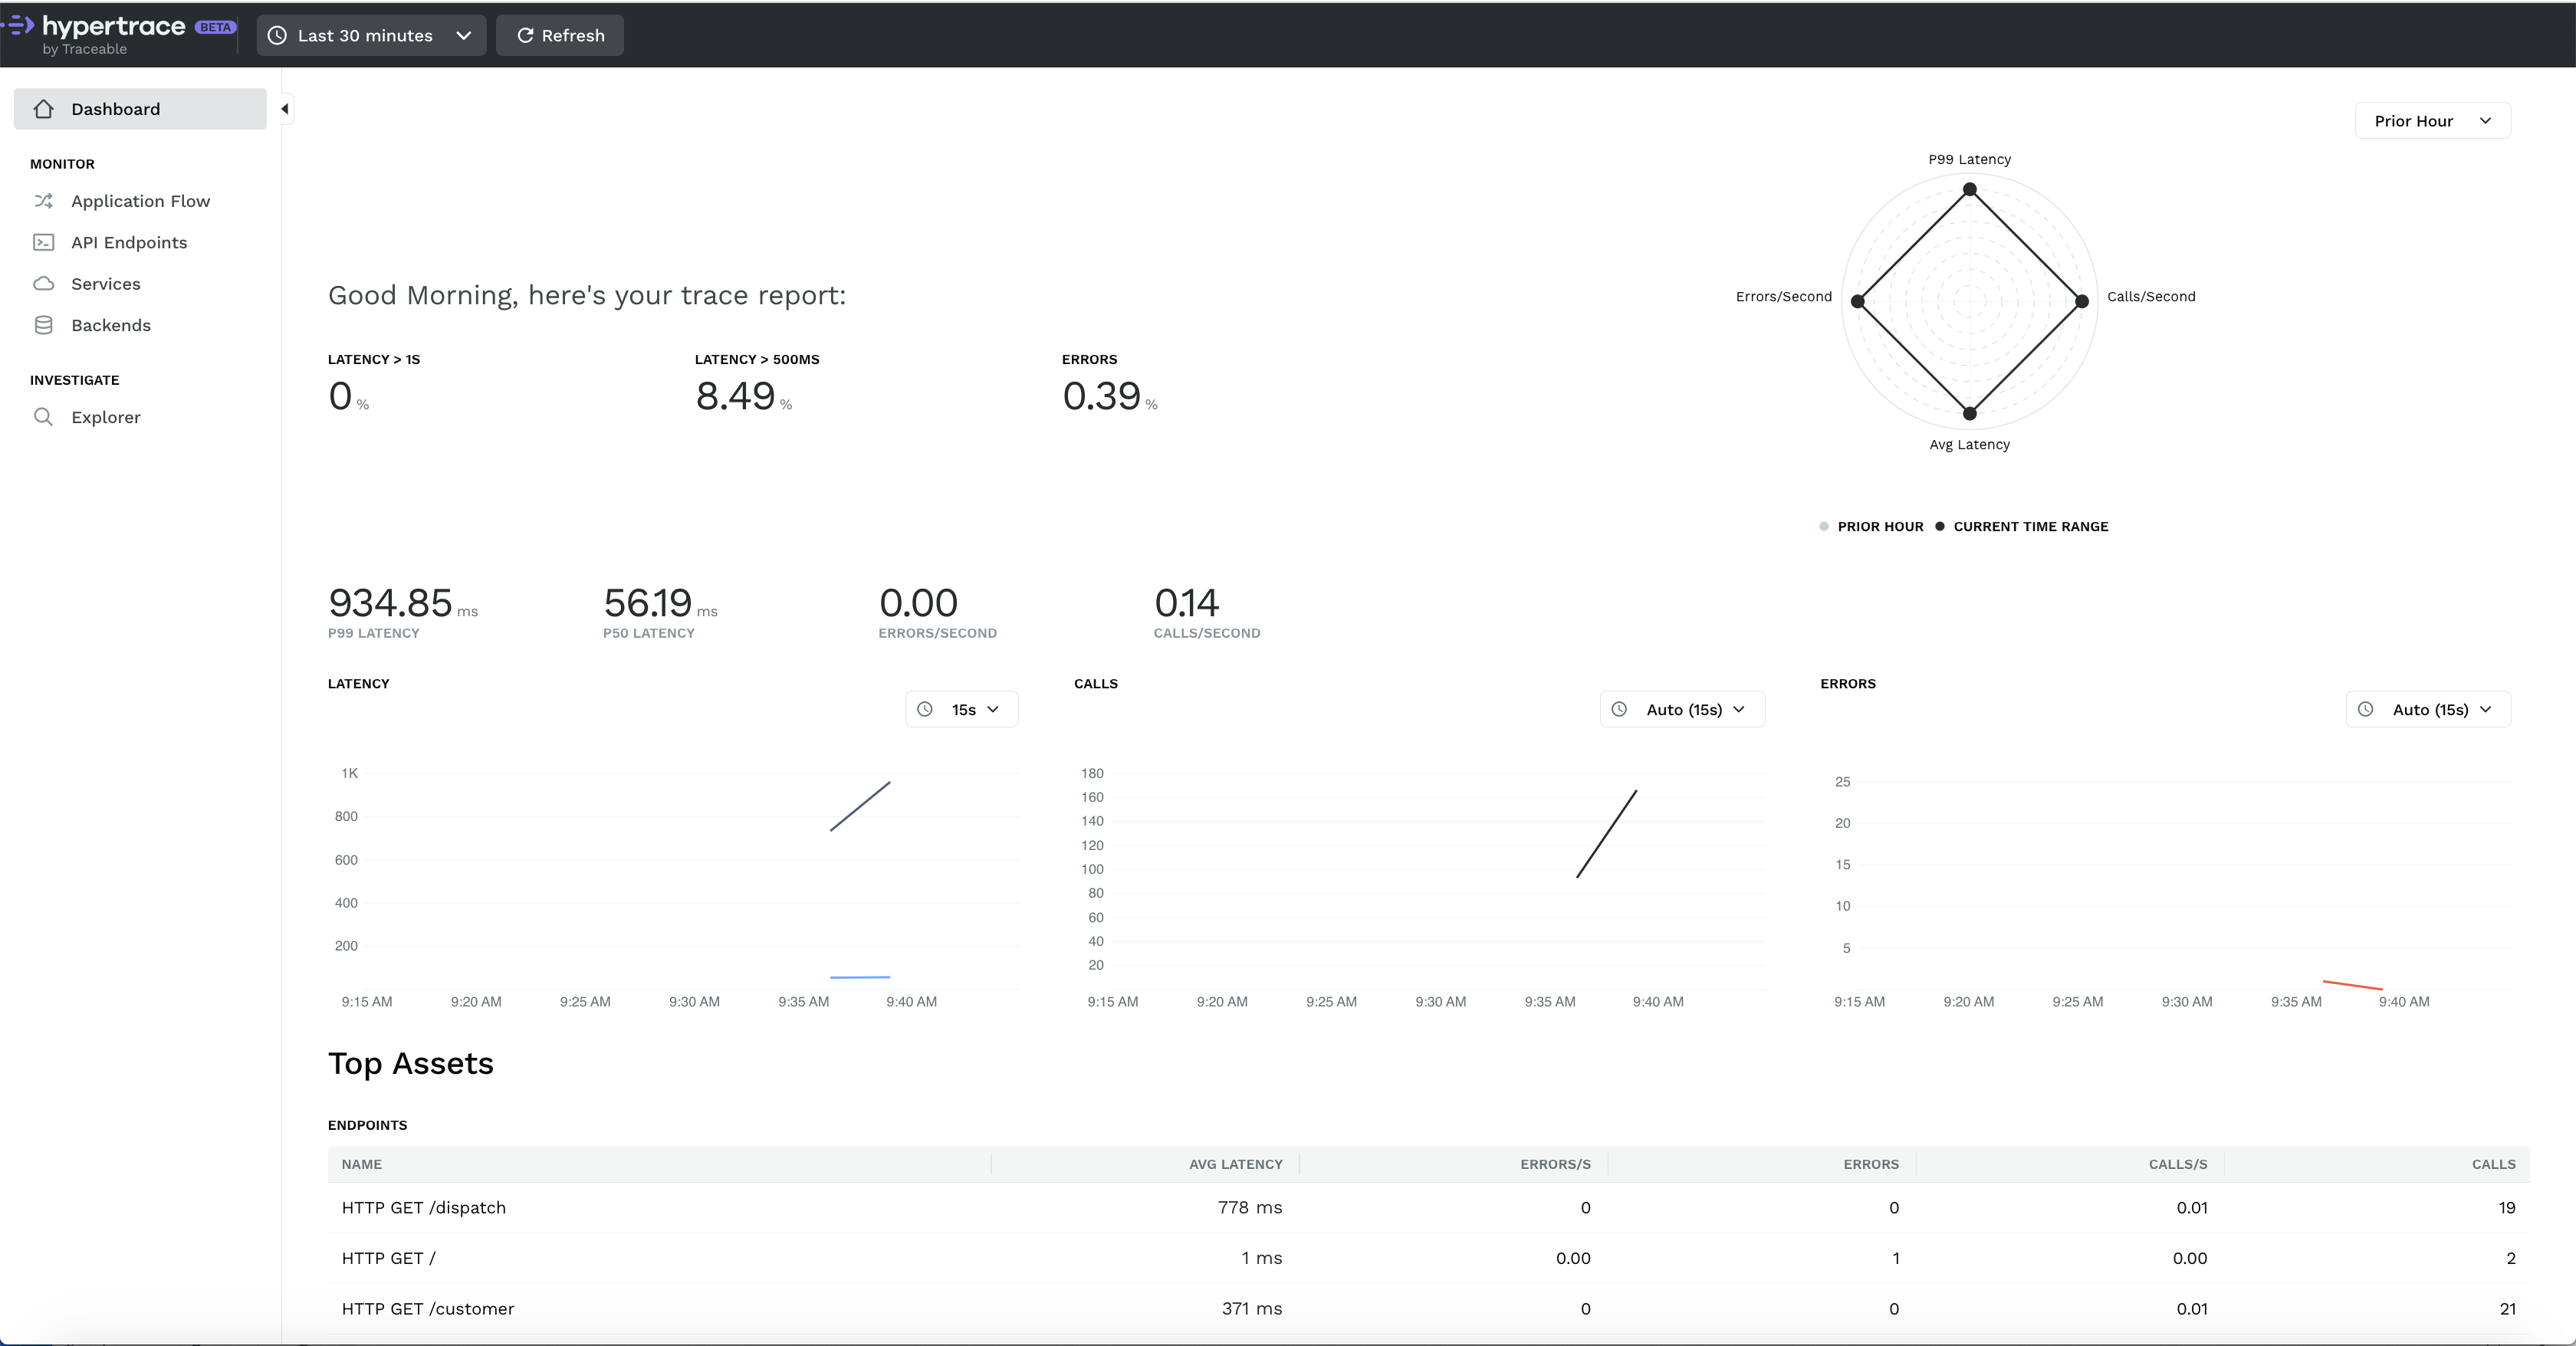
Even compared to commercial products, we think this will delight you.. and to think this is free and open!. The goal of Dashboard is less guessing. Instead of knowing search parameters, dashboard tries to present you with relevant things It shows you the Latency rate and Error rates along with P99 and P50 Latency and Calls per second matrix.
If you haven’t seen this before, this chart on the top right is a radar chart. Radar charts help visualize multivariate data, showing error rate and call rate along with total errors and calls. By default, it compares current time range (here we selected 15 minutes) with data from the last hour. In other words, you can see how the current performance or error count compares with requests from the last hour. You can also change the comparison factor to the last day, week or even month!
Below that we have latency/unit time, call/unit time and errors/unit time graph for chosen time range.
Then if you scroll down you will get lists of top assets including top endpoints, top services and backends with metrics like avg latency, error rate, total errors, call rate and number of calls. Like other parts of the dashboard, this is typically not something you’ll see in a trace-only UI. You can click on those to sort them according to increasing or decreasing order to learn the fastest or slowest endpoints!
Application flow
 |
|---|
| Application Flow with Hypertrace |
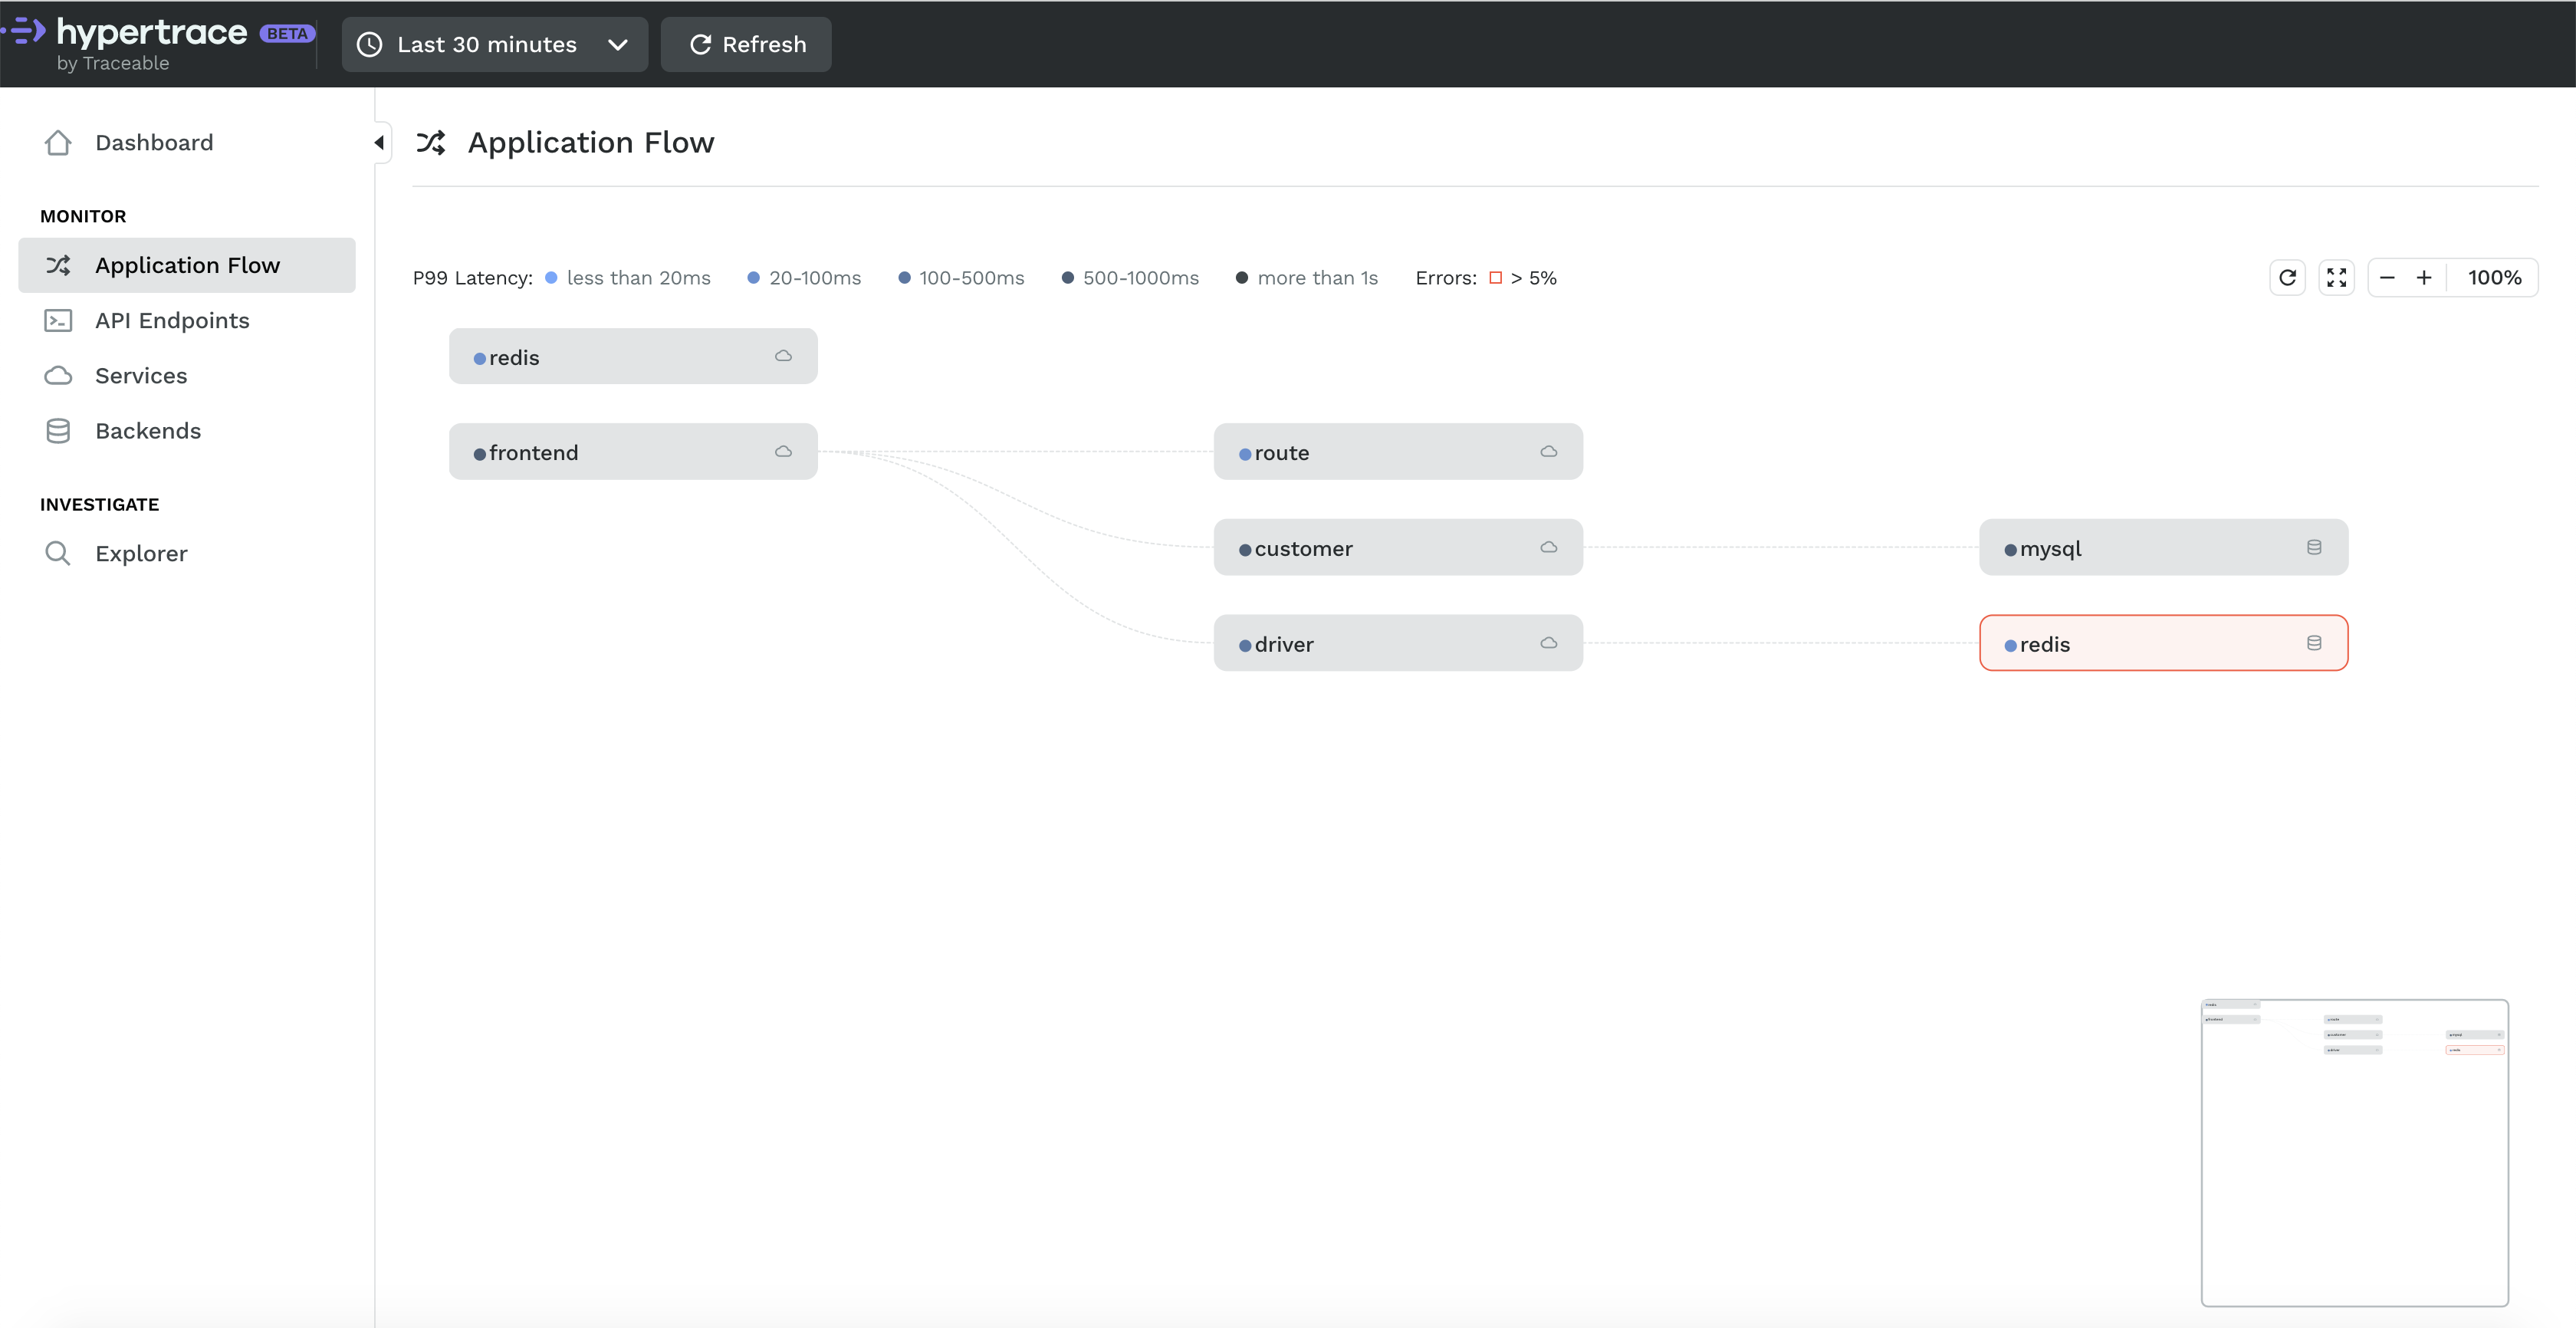
Application Flow shows your service requests in aggregate: it is a live architecture diagram! With this diagram we can see how Online Boutique communicates: Here the frontend is sending requests to several microservices. If you hover over a service, Hypertrace highlights the trace path and will show you a bunch of details less common in trace only solutions. For example, the link between two services will show you P99 latency between those two services. You also get a mini view at the bottom right corner where you can select the part you want to focus on and it will show you that part only which is great when you have a very complex microservice network like Netflix and everything can’t fit on a screen at the same time. Yes, we are talking scale my friends!
Of course this does normal controls like zoom and refresh which you can find in top right corner.
Services
 |
|---|
| List of all services in application with Hypertrace |
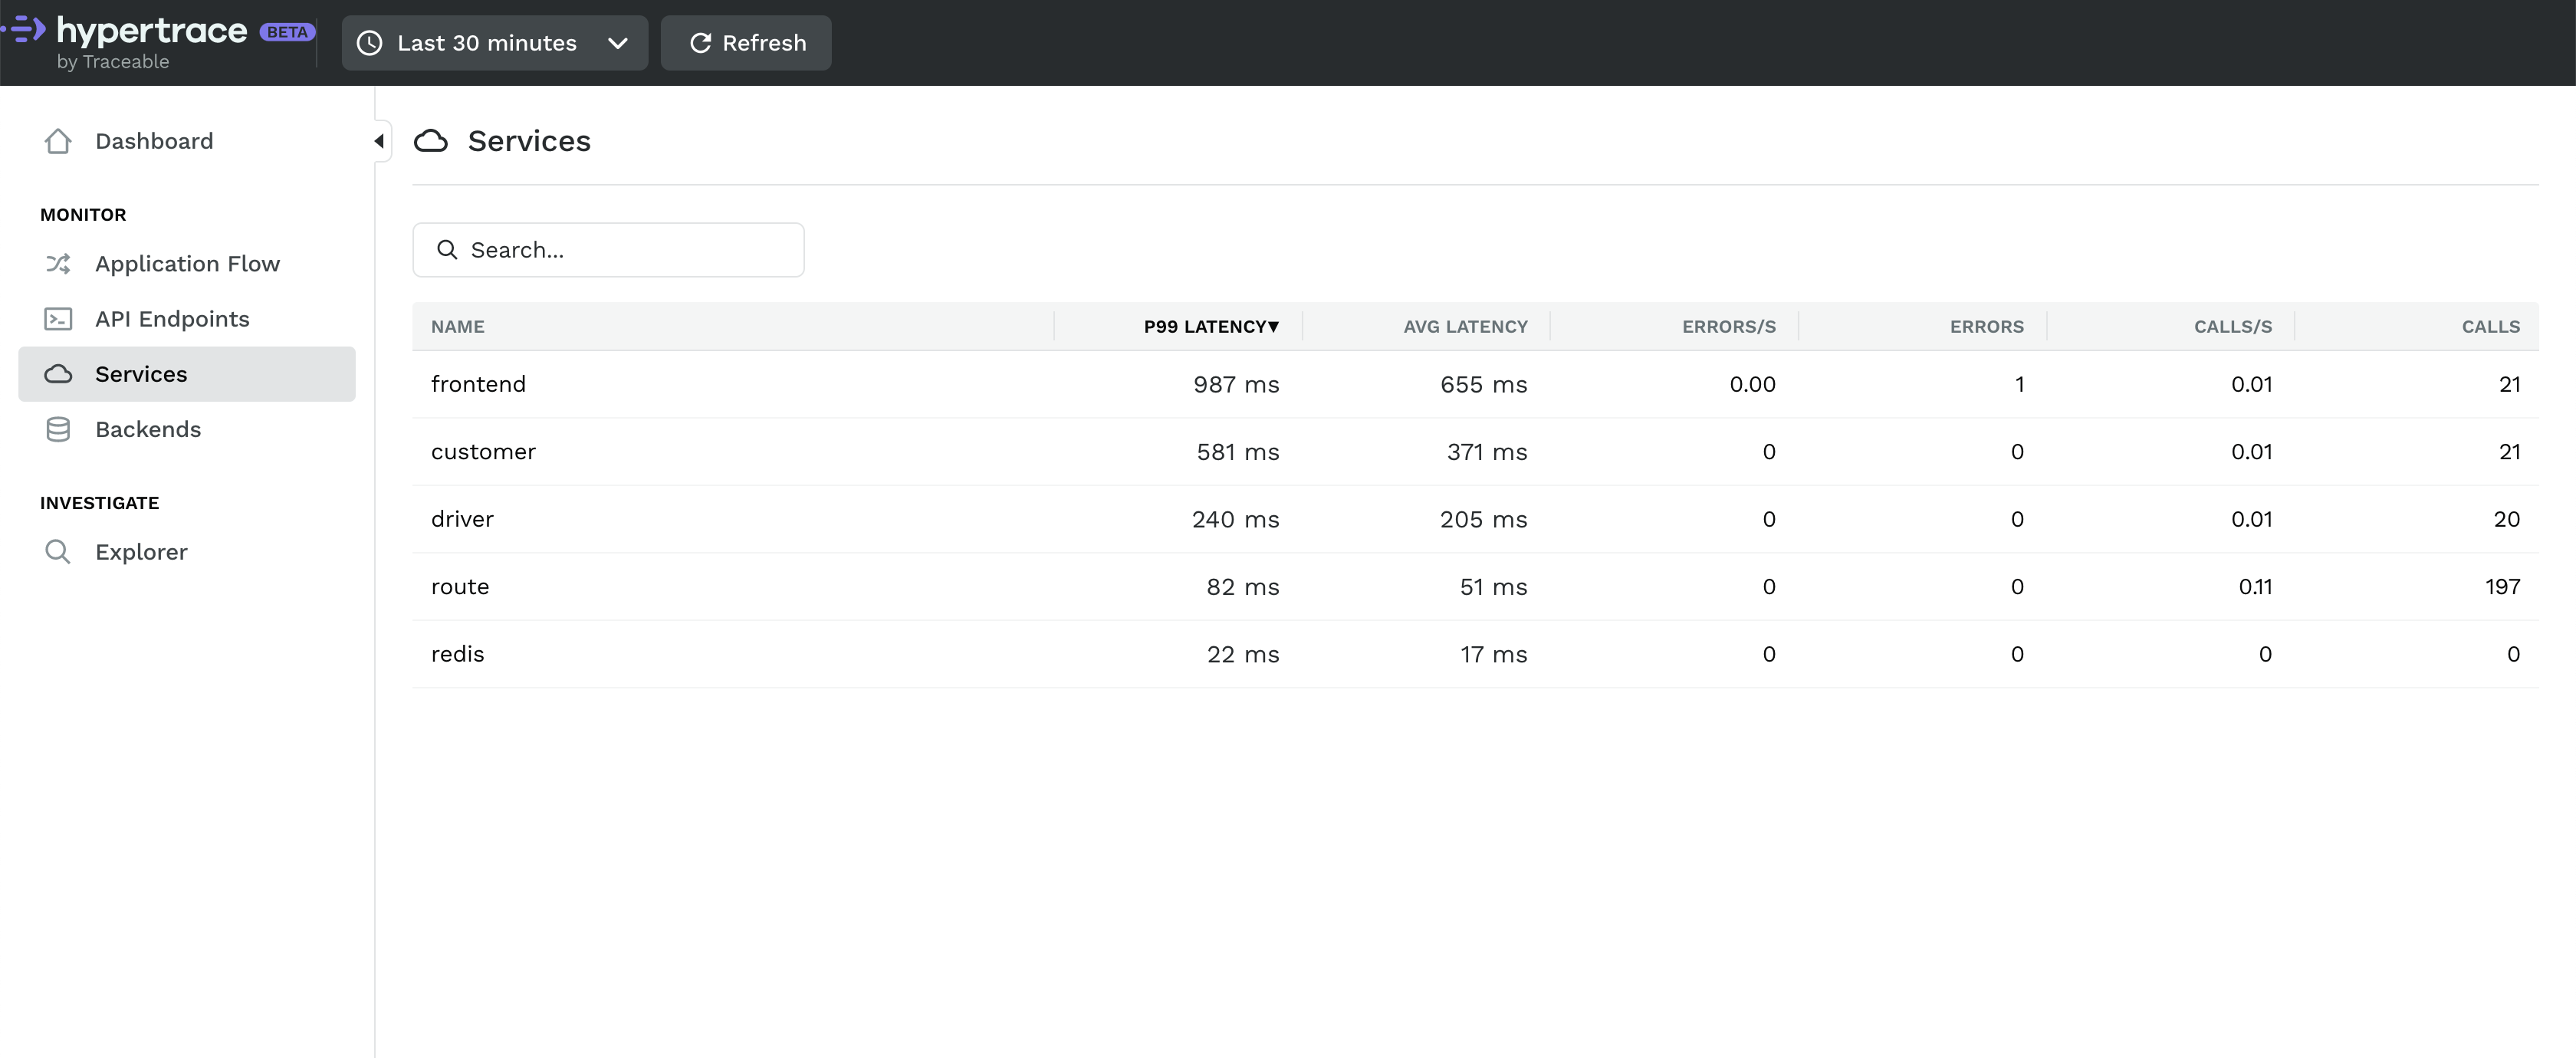
Services section in hypertrace shows you all the services your application has and if you increase timeframe you can even see list of all services sent traces to Hypertrace in last few hours or even days.
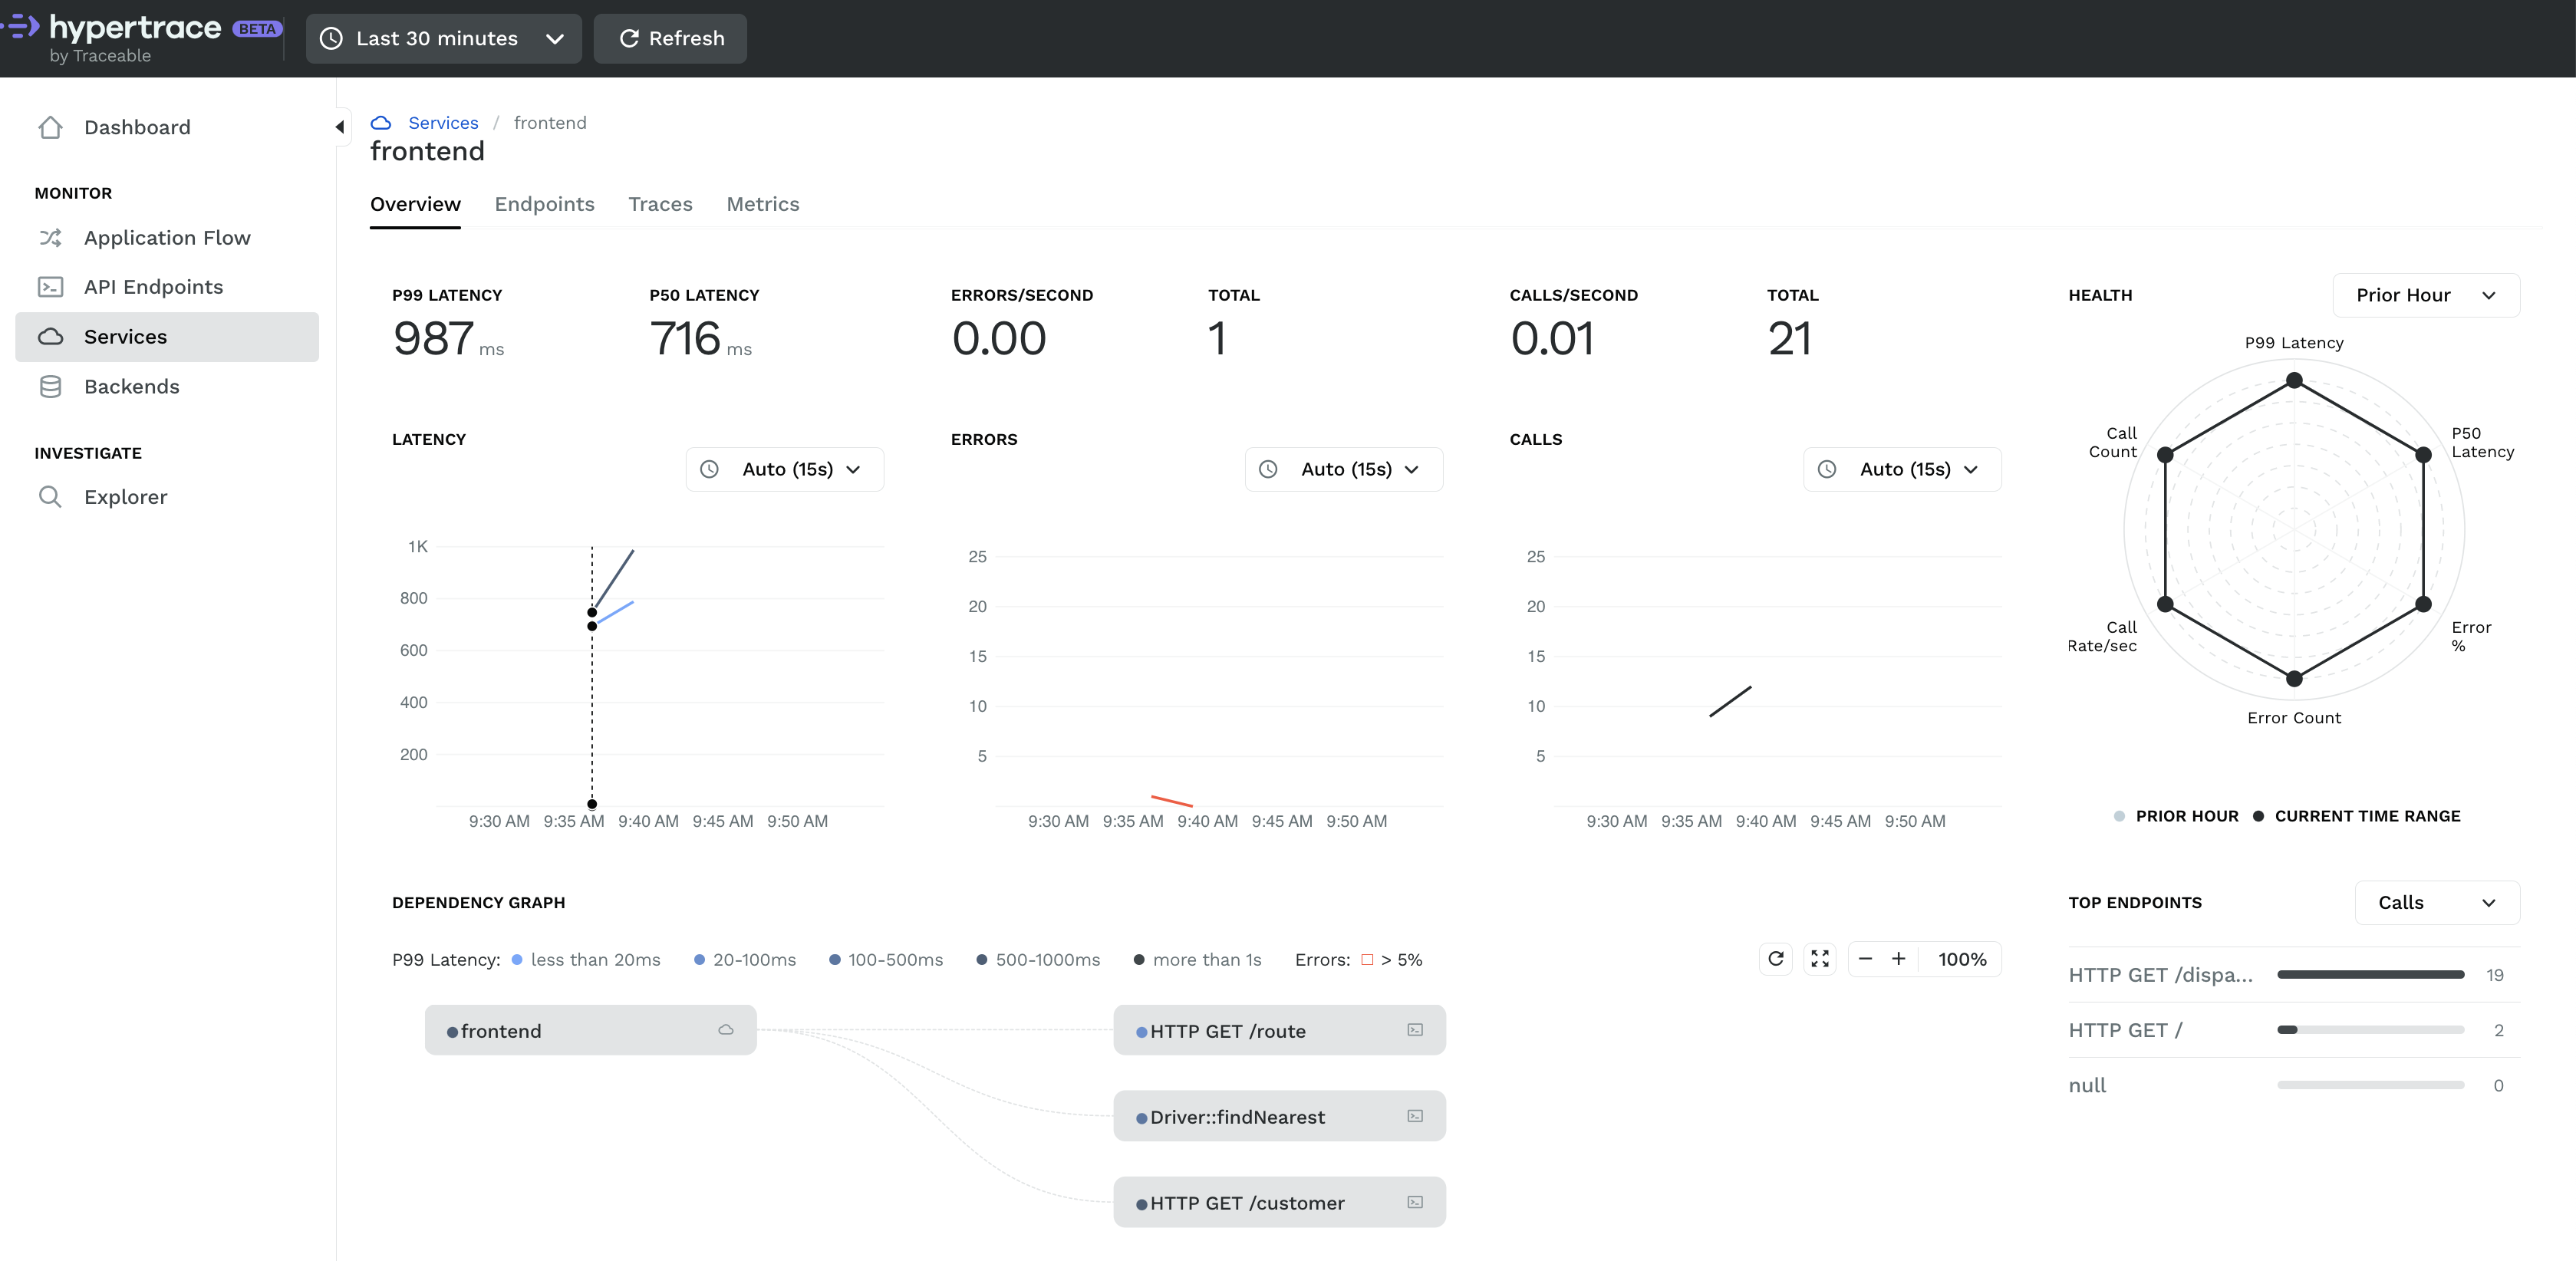
Service details
 |
|---|
| Frontend microservice details with Hypertrace |
This section will list down all traces under that particular service and you can click on any one to see the colorful waterfall diagram! Here you can see how much time each service is taking and if any service is taking more time than expected you can say that there’s some performance issue with this one let’s troubleshoot and you can solve it!
At the same time, there can be millions of traces, so search is an important feature. There are many parameters you can search on, such as tag, status, duration, apiTraceid, apiName, etc. You can combine parameters to help you narrow down your search and even use range expressions. For example you might want to search for a specific apiNameendpoint where the trace took more than 100 ms. To do this you would specify apendpointName = /carRECV./ t, duration >= 100.
Traces
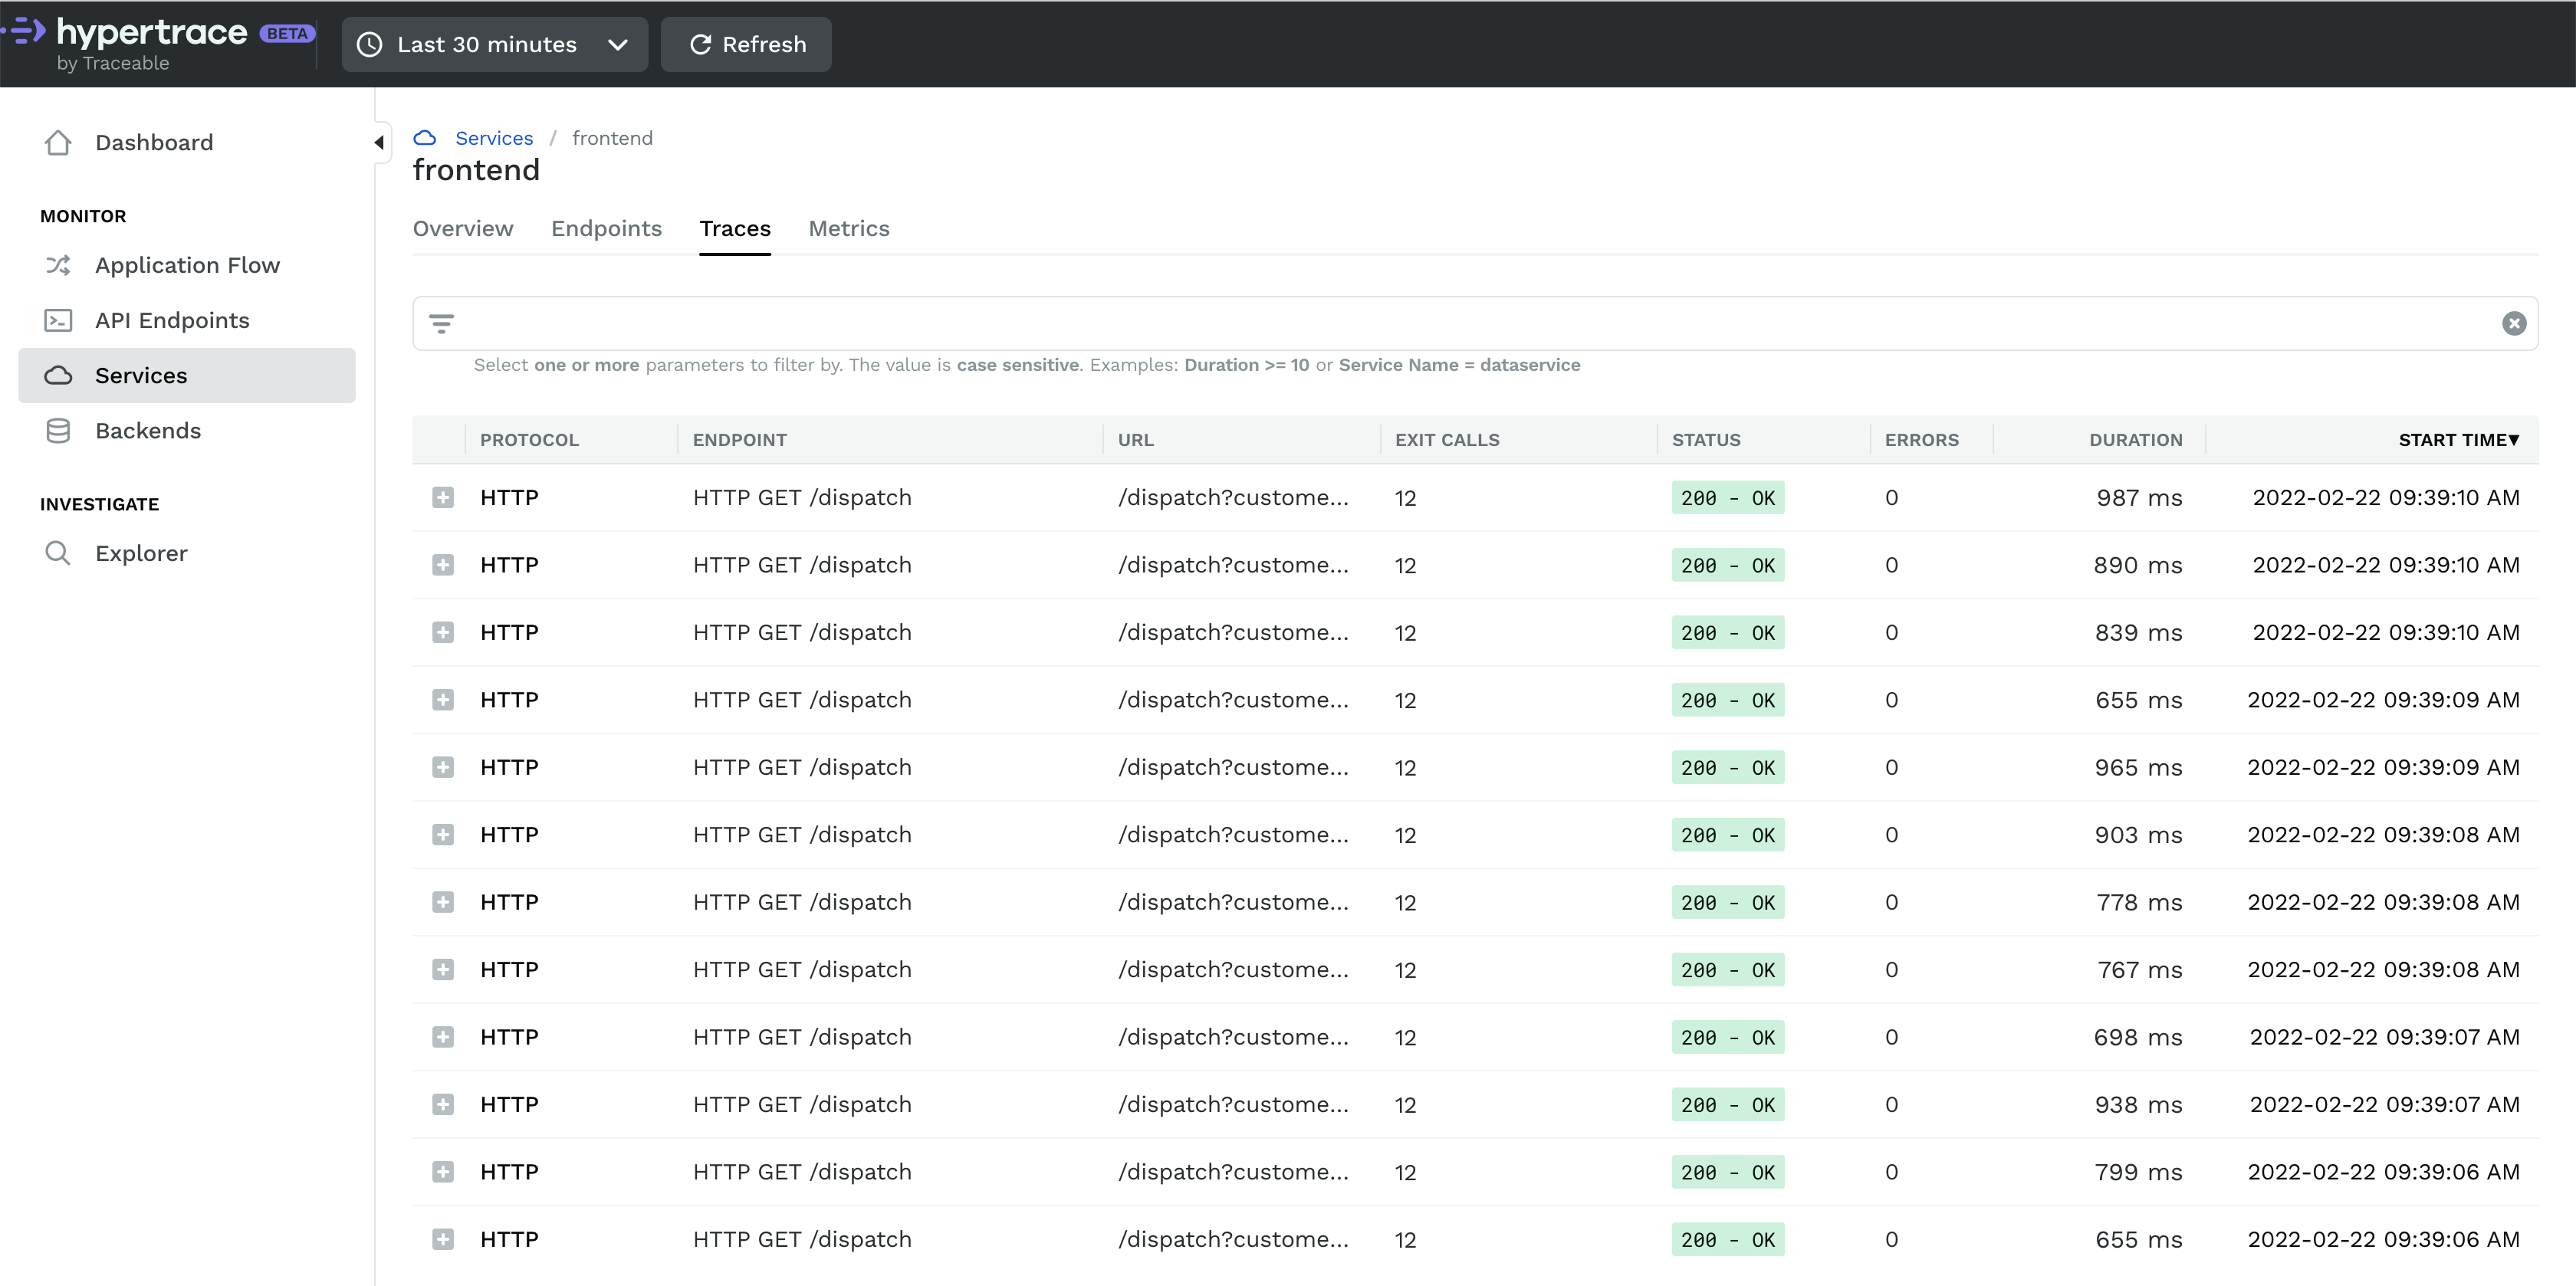 |
|---|
| Tracing with Hypertrace |
This section will list down all traces under that particular service and you can click on any one to see the colorful waterfall diagram! Here you can see how much time each service is taking and if any service is taking more time than expected you can say that there’s some performance issue with this one let’s troubleshoot and booom!
At the same time, there can be millions of traces, so search is an important feature. There are many parameters you can search on, such as tag, status, duration, endpoint Traceid, endpointName, etc. You can combine parameters to help you narrow down your search and even use range expressions. For example you might want to search for a specific endpoint where the trace took more than 100 ms. To do this you would specify endpointName = RECV./, duration >= 100.
Backends
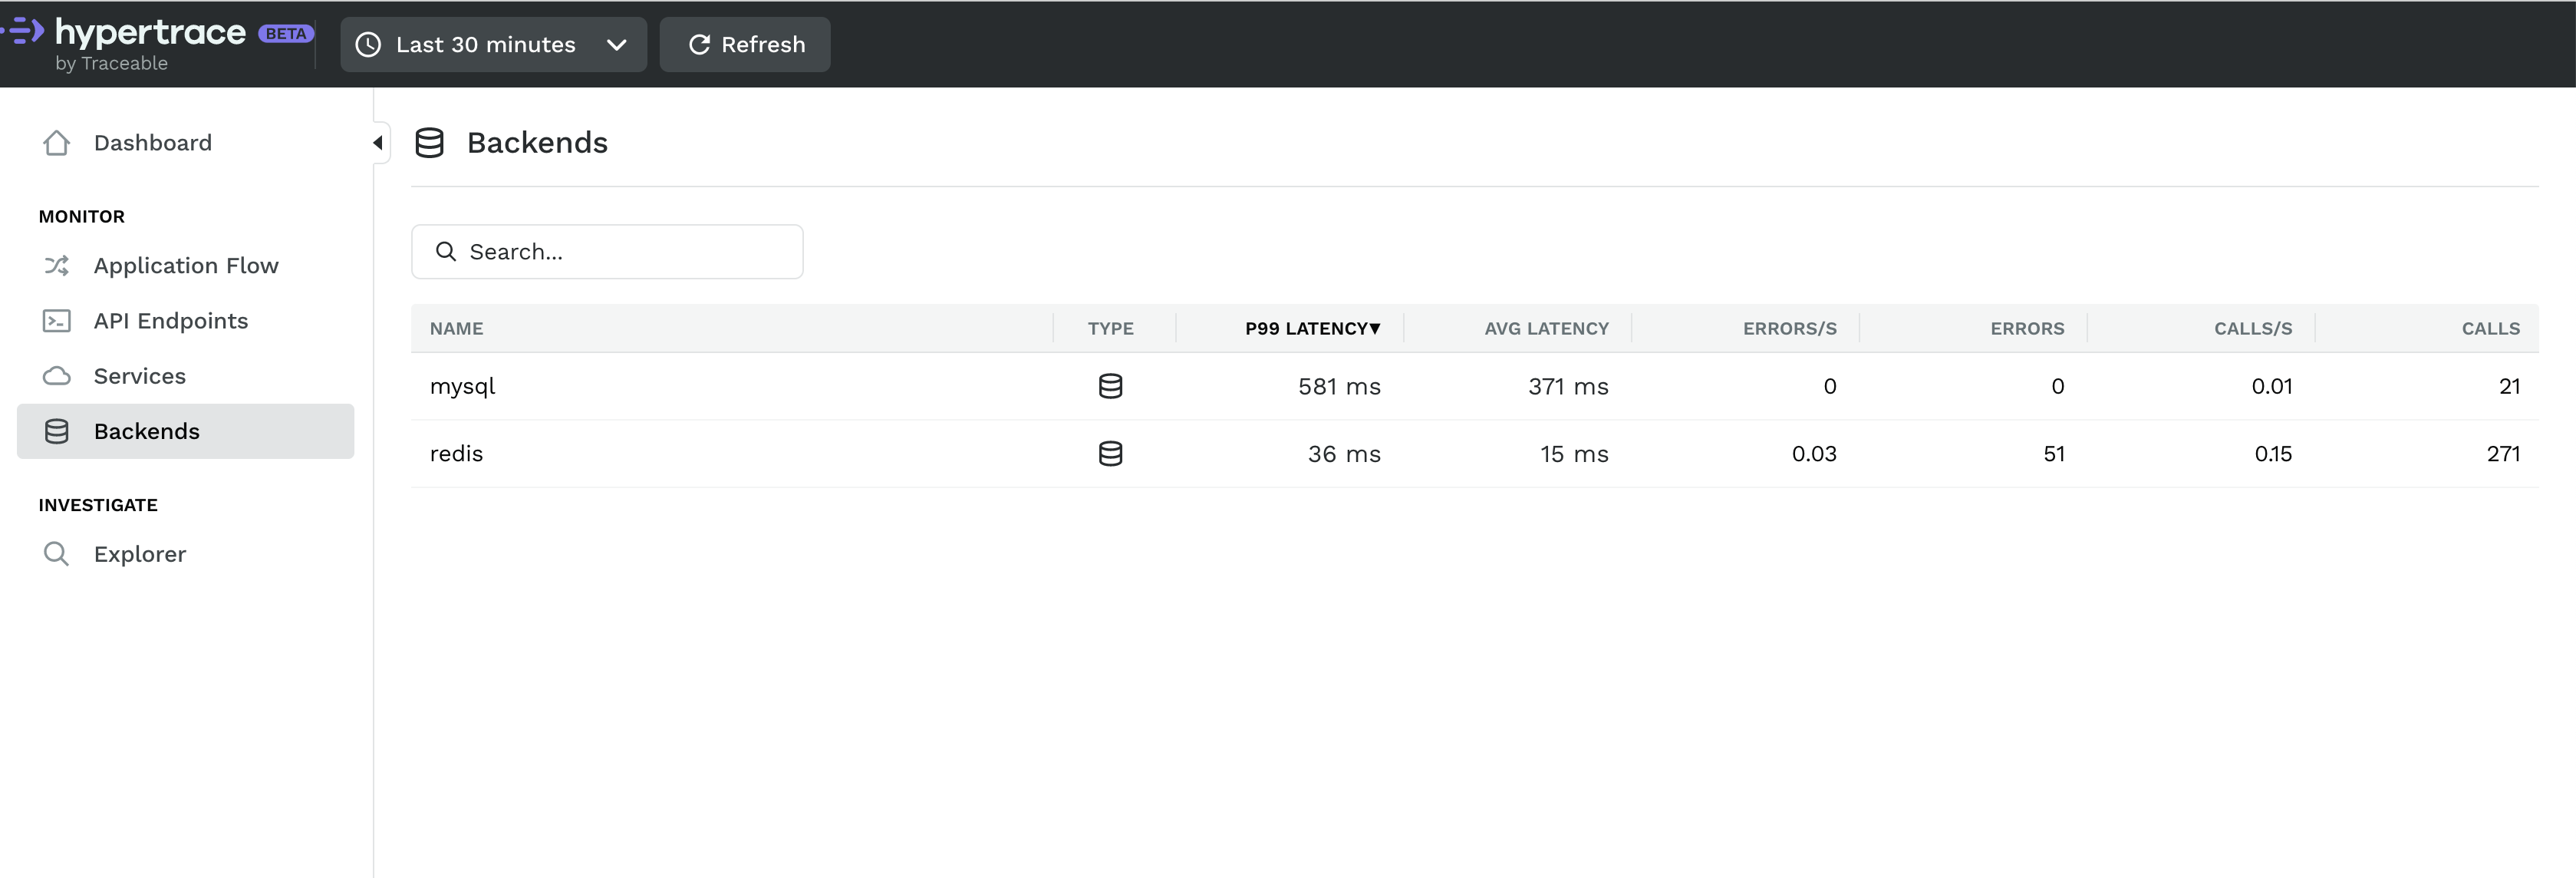 |
|---|
| Backends with Hypertrace |
Backends are typically databases, like MySQL and Redis. Insights here are derived from client requests and most helpful to infrastructure teams trying to understand which queries are causing performance problems. a backend overview should look familiar. It visualizes latency, error and call count along with a list of services using this backend! The traces tab is tuned for the backend owner, for example to see requests coming into MySQL
Explorer
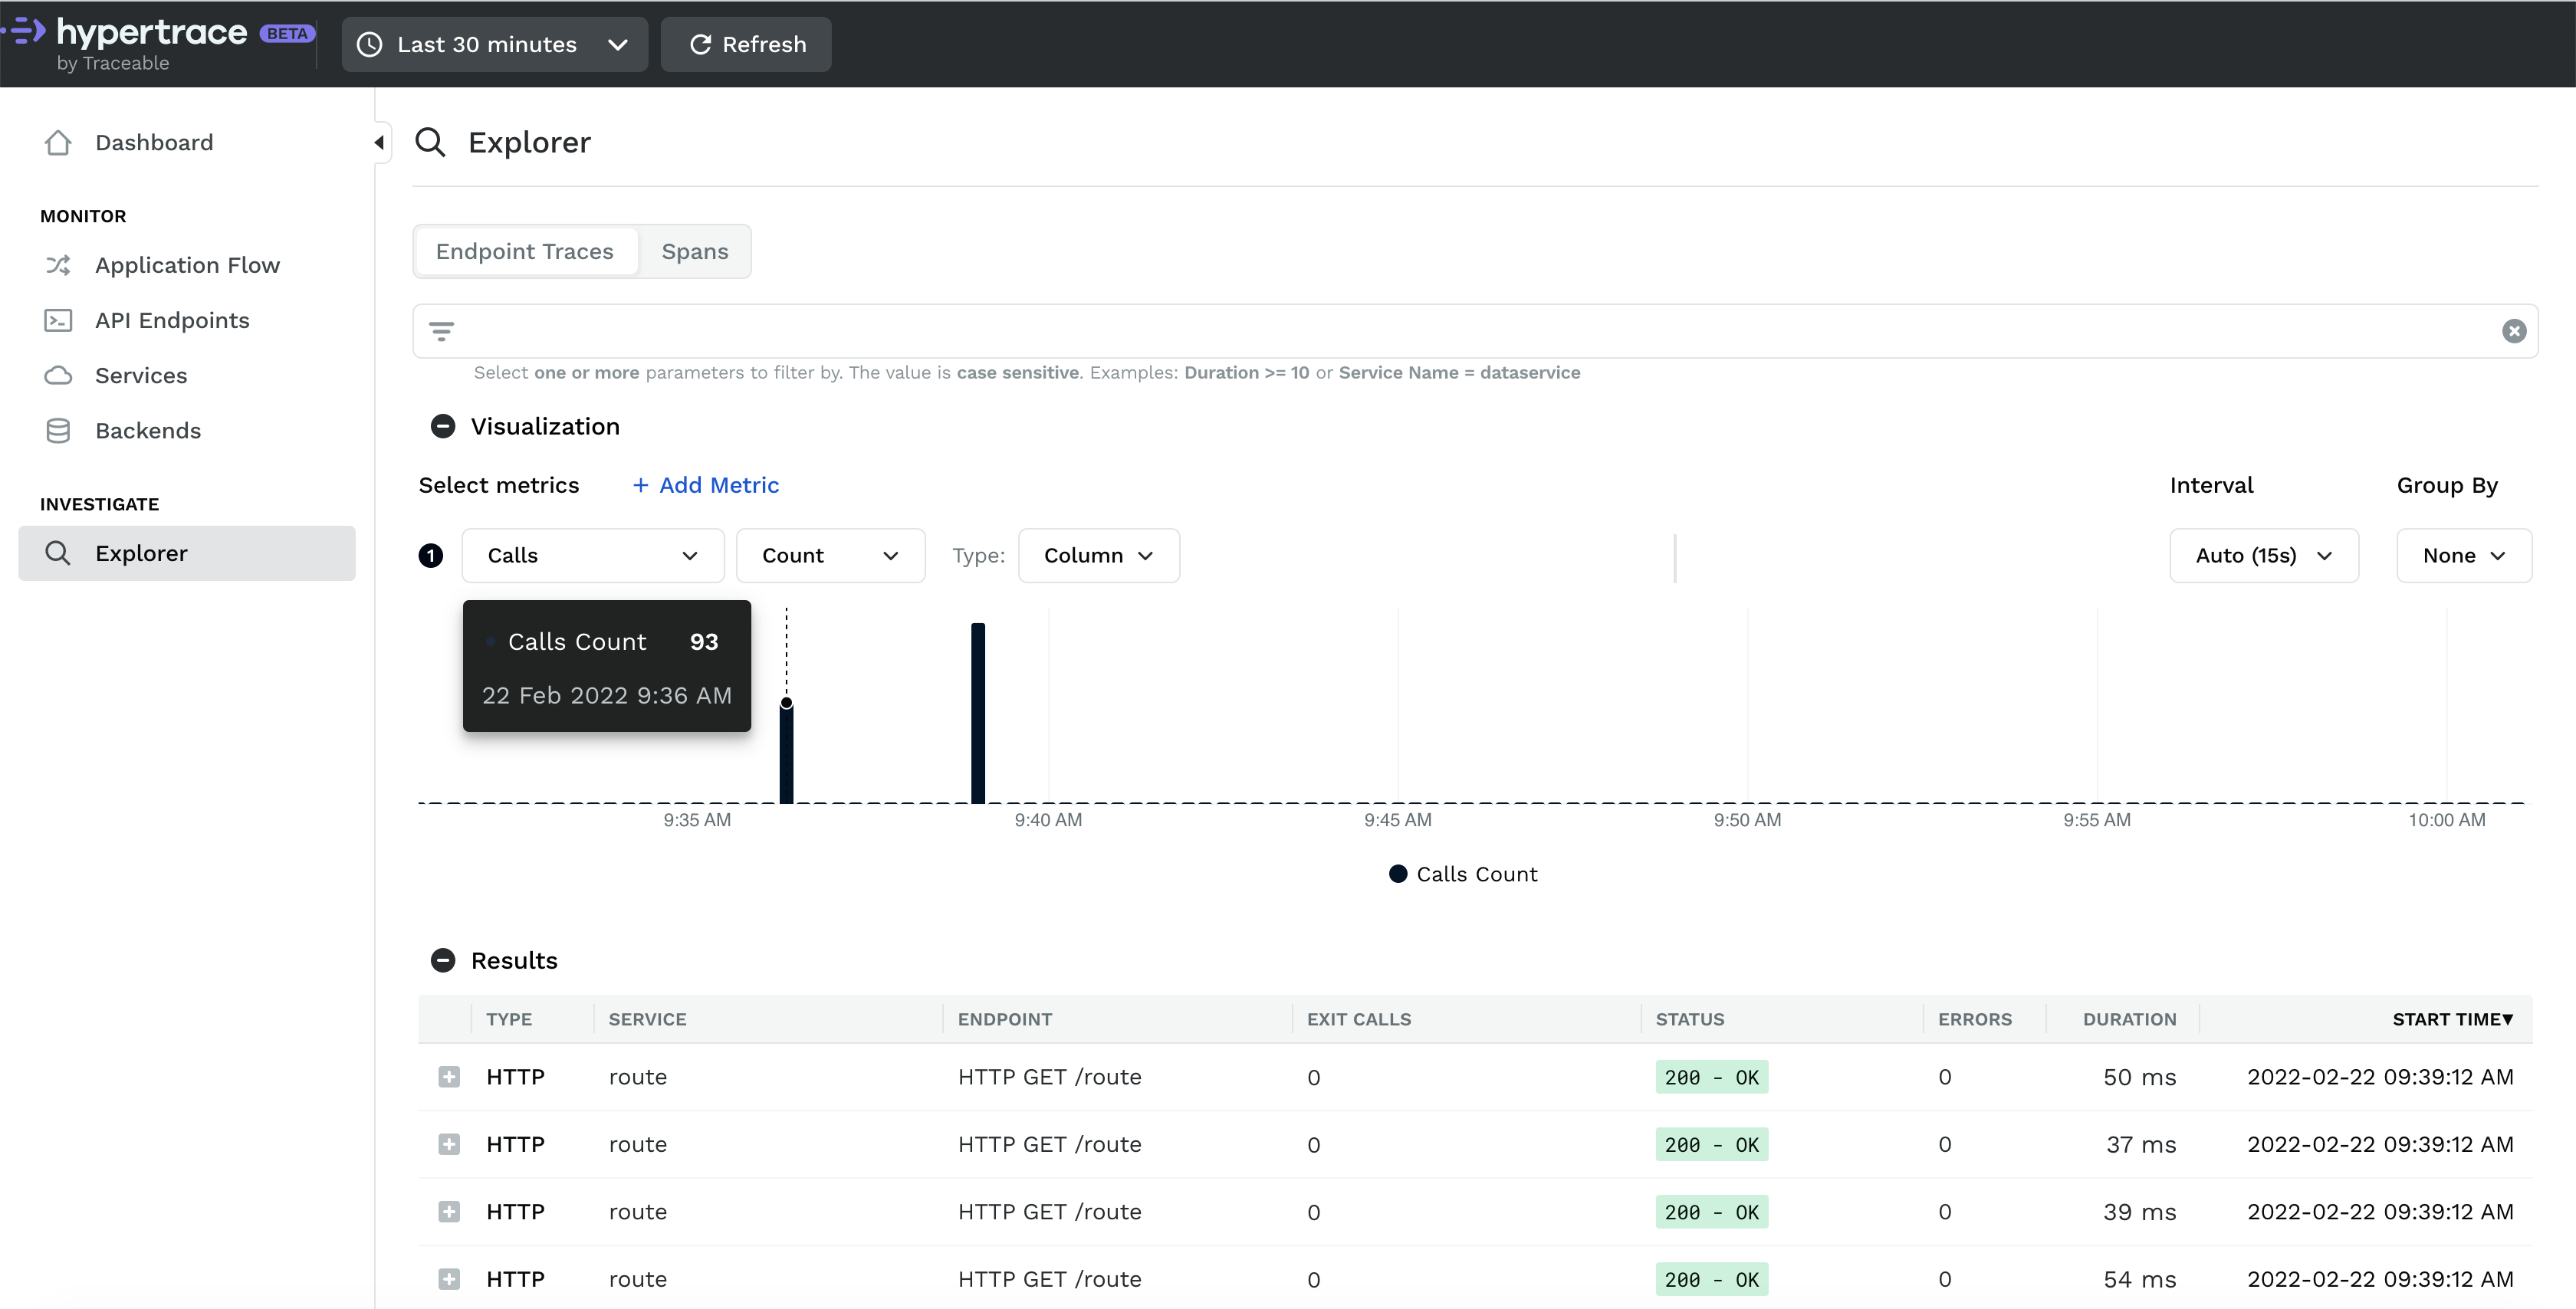 |
|---|
| Hypertrace Explorer |
The Hypertrace Explorer helps you identify problems in your application. Those who’ve used distributed tracing in the past may find this familiar: If you know what you are looking for, you can search for almost anything. For example, you can look up traces from the cranky customer complaining about their order.
As you start exploring, you can refine further: you can limit based on tags, a trace ID in a log file, or combine parameters together to find that needle in the haystack
What’s neat is you can add metrics to compare them using visualizations as well. Let’s add the P99 latency line graph so we can see how informative this can get.
You might notice we didn’t wait for anything. Traces from application requests process in real time.However, we’re often interested in a problem that happened in the past. Hypertrace can show you metrics from predetermined time periods or even a custom range. The results in the bottom will change according to our search criteria. If you are looking for spans matching your search criteria instead of endpoints you can switch the toggle in top left corner to spans and do that!