Instrument your Golang application with Hypertrace Go agent
Hypertrace Go Agent is built on top of OpenTelemetry, and hence, supports all the frameworks and libraries that it supports. Hypertrace Go agent not only enriches all the features brought by OpenTelemetry but also hides the complexity around configuration so developers can focus on the features that matter for them.
Getting started
As a part of the great user experience we want to provide comes from the fact that we want to support those applications that are already instrumented without asking them to change the entire instrumentation. In that sense, Go Agent can perfectly work with applications already instrumented with OpenTelemetry and OpenCensus (and there are more to come!)
Bootstrapping Go Agent is crazy simple. You can setup values directly and also read environment values
func main() {
    cfg := config.Load() // load env values
    cfg.ServiceName = config.String("my-app")

    shutdown := hypertrace.Init(cfg)
    defer shutdown() // force to flush traces when application finishes.
}
or you can also set configuration values either from a config file
func main() {
    cfg := config.LoadFromFile("./config.yaml") // load file and env values
    cfg.ServiceName = config.String("my-app")
}
Then you just need to instrument your app like any other one:
client := http.Client{
    Transport: hyperhttp.NewTransport(http.DefaultTransport),
}
and data will show up in Hypertrace:
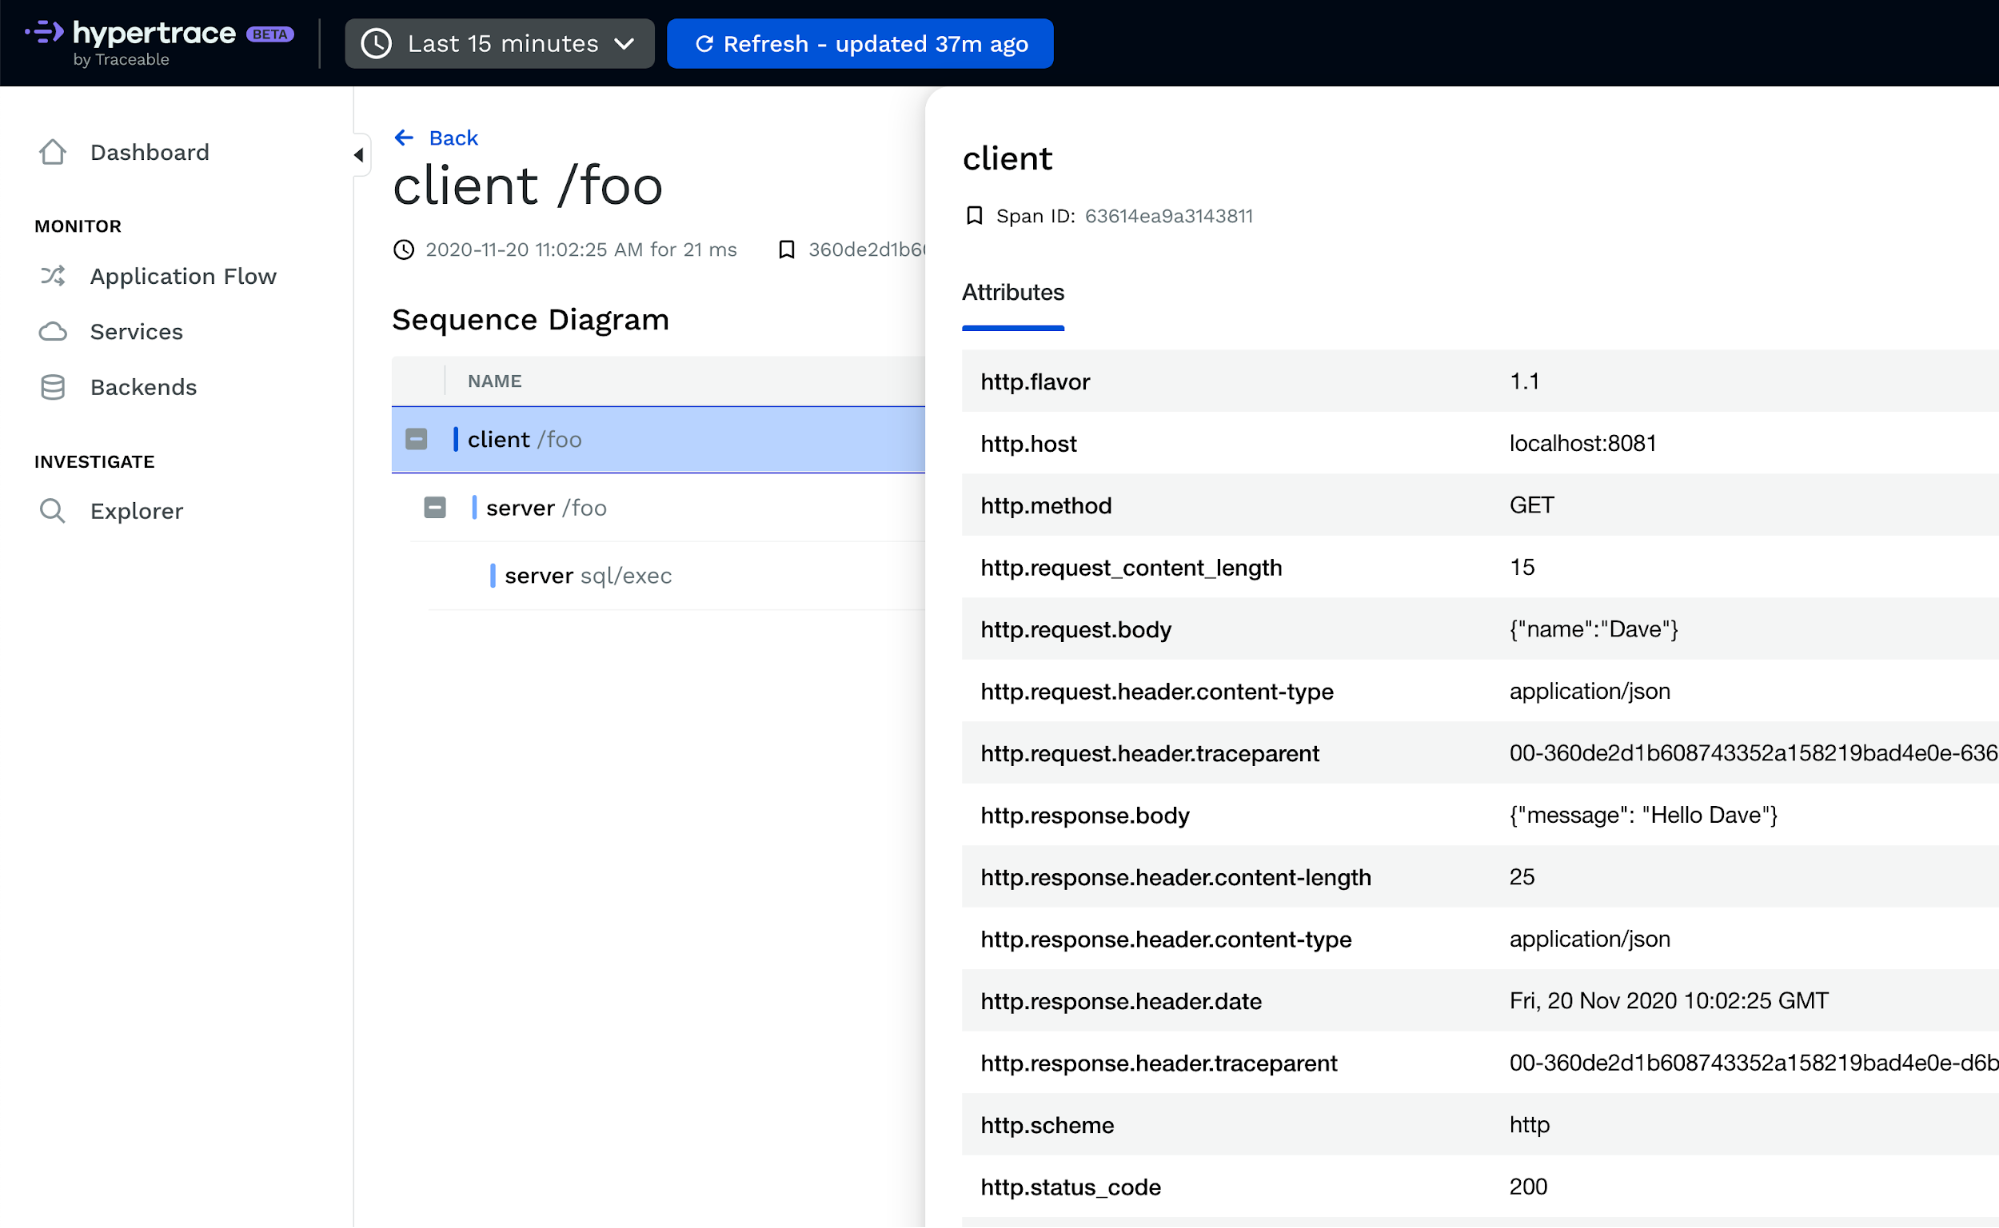
You can see a full example in action in this example repo.
Instrument your Golang application with OpenTelemetry Go agent
OpenTelemetry has detailed instructions on how to get started with OpenTelemetry-go implementation.
Instrument
The easiest way to instrument your golang application to start capturing distributed traces and metric events is by using an instrumentation library for your code. Be sure to check out the officially supported instrumentation libraries.
If you need to extend the telemetry an instrumentation library provides or want to build your own instrumentation for your application directly you will need to use the go.opentelemetry.io/otel/api package. The included examples are a good way to see some practical uses of this process.
Export
Now that your application is instrumented to collect telemetry, it needs an export pipeline to send that telemetry to an observability platform.
You can find officially supported exporters here and in the companion contrib repository. Additionally, there are many vendor specific or 3rd party exporters for OpenTelemetry. These exporters are broken down by trace and metric support.