Hypertrace is a cloud native distributed tracing and observability platform designed to ingest and analyze large volumes of production trace data. various open-source and enterprise agents and tracers collect and send observability data directly from applications to Hypertrace for analysis. Data visualizations, reports, and dashboards are available in a web-based console to assist in monitoring cloud-native applications and resolving application and service performance problems.
Let's take a look at Hypertrace architecture and undestand each component in details.
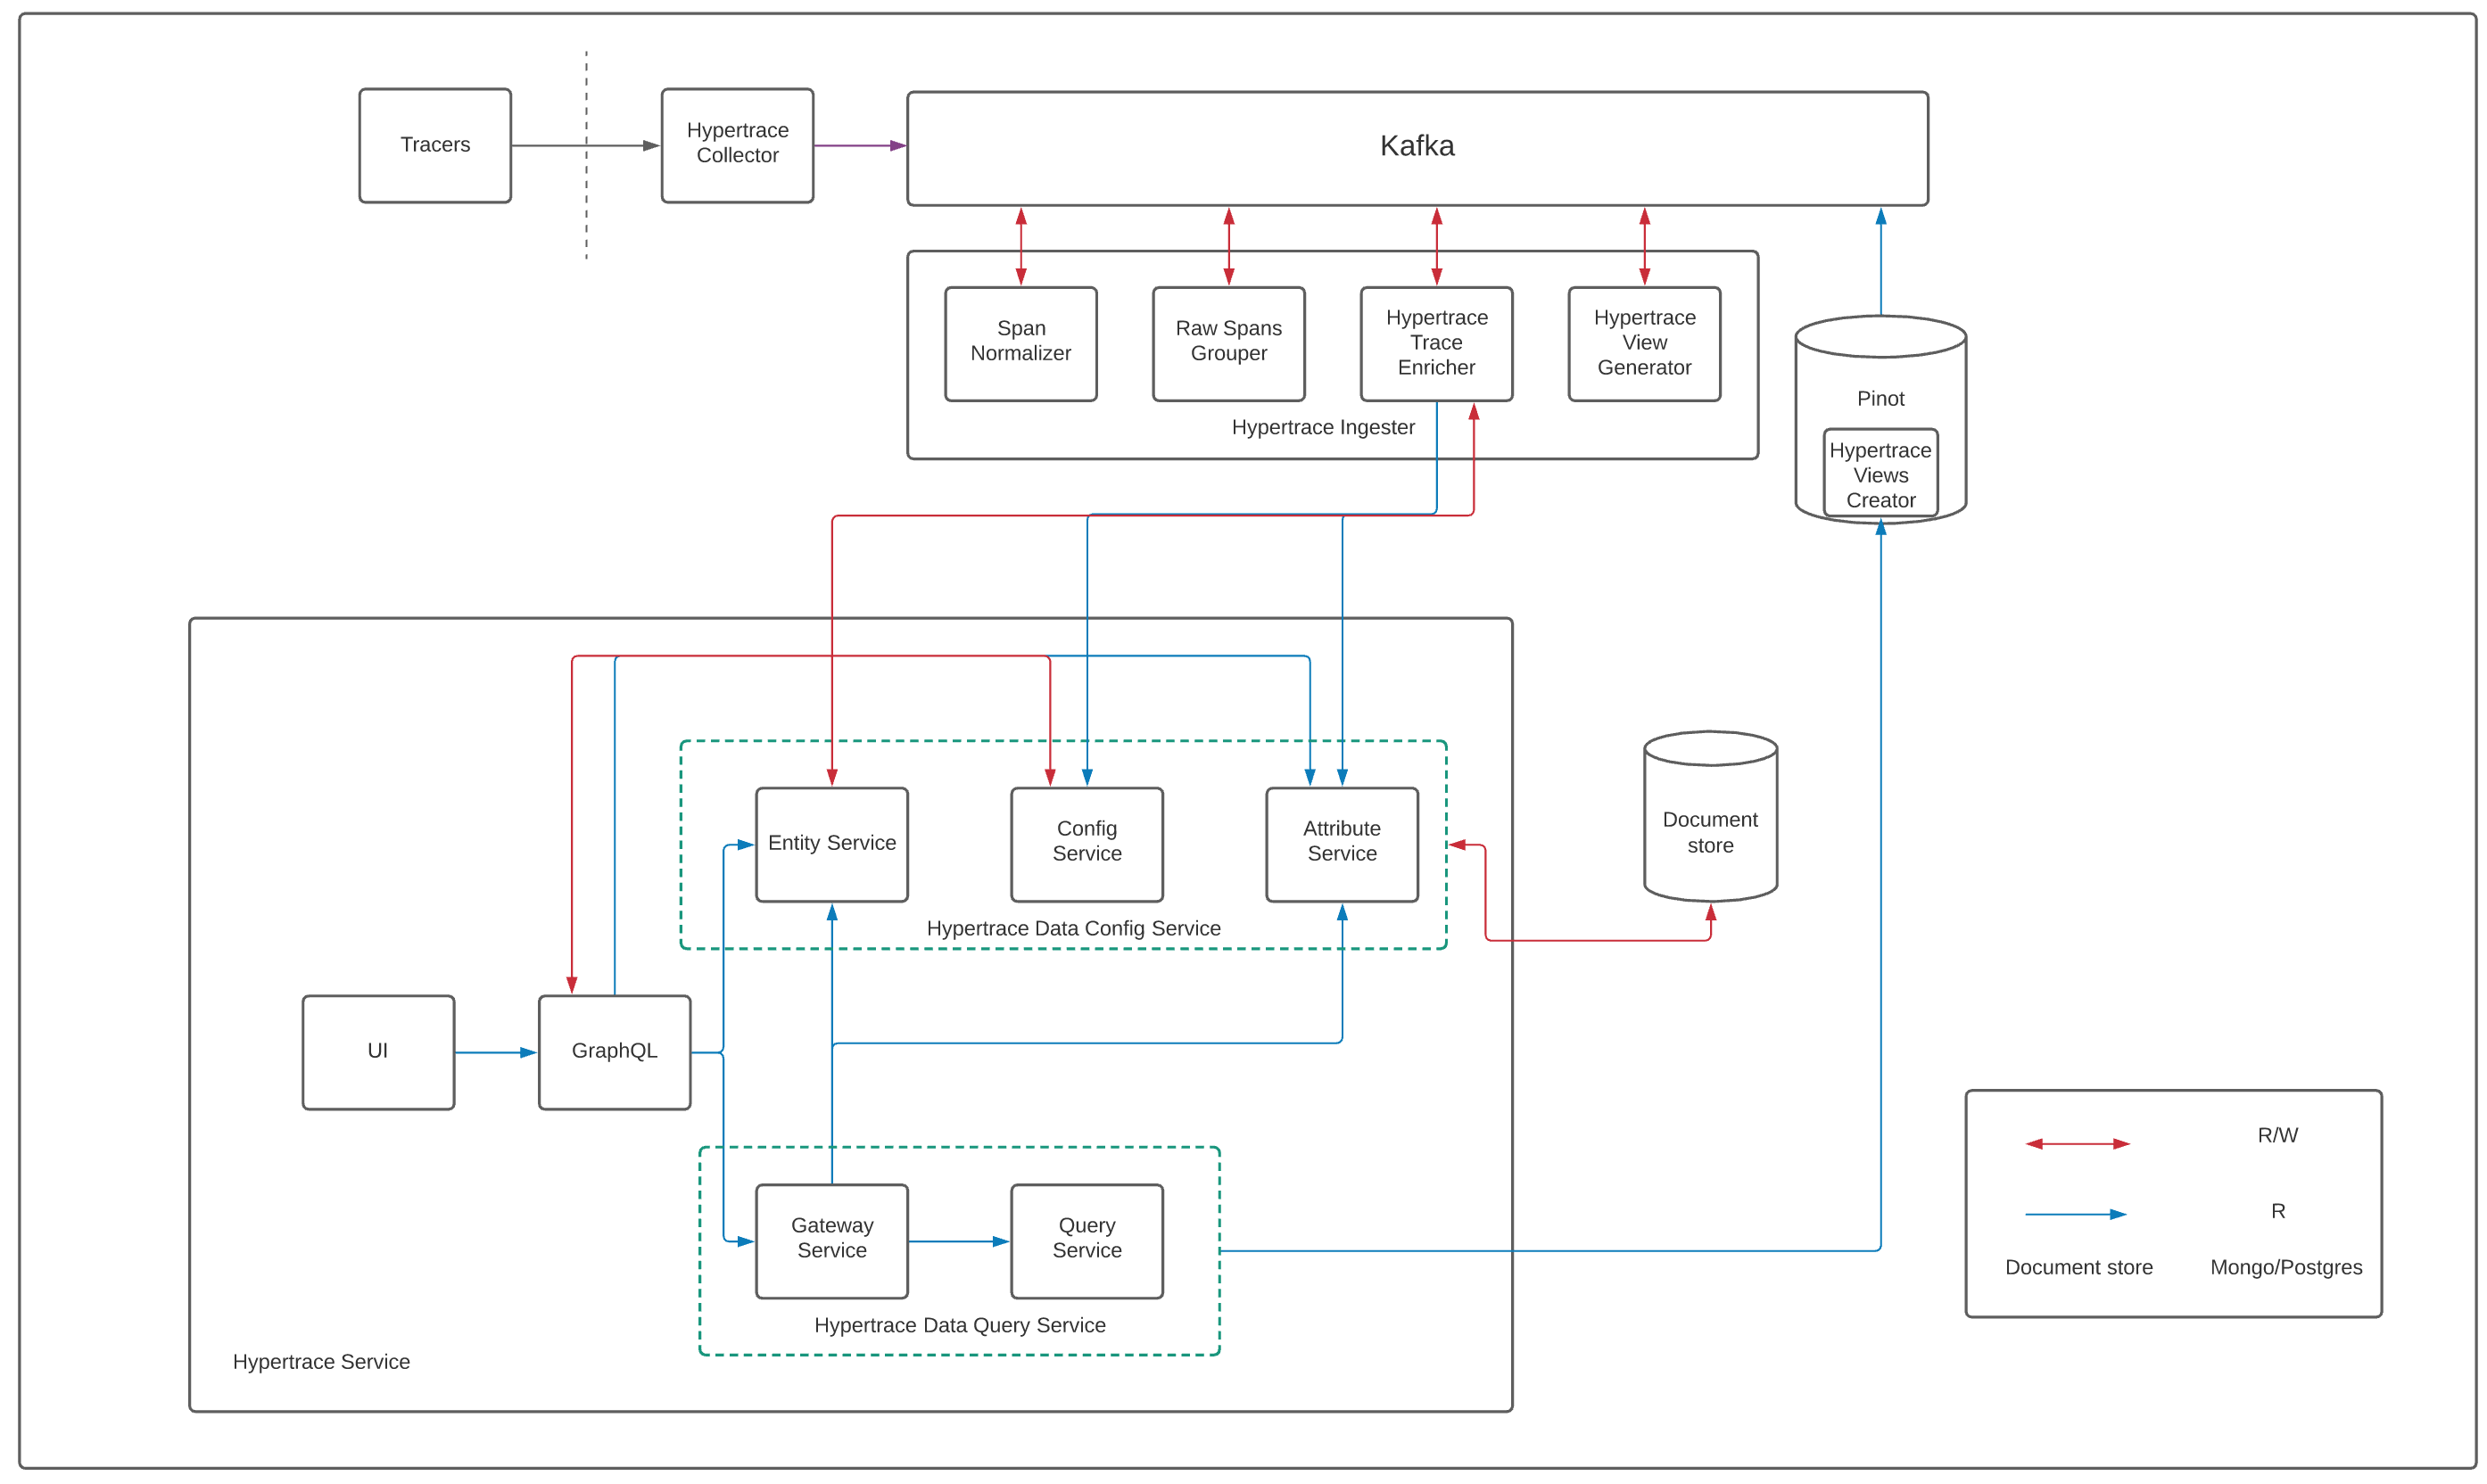 |
|---|
| Hypertrace Architecture |
Working of Hypertrace starts with developers instrumenting their applications with tracing libraries or agents. Hypertrace supports all the major tracing formats including OpenTelemetry, Jaeger and Zipkin. You can also use Hypertrace Java agent, Go agent, Python agent to instrument your applications without making any code changes.
Hypertrace pipeline starts with Hypertrace Collector which is based on OpenTelemetry collector. The Hypertrace Collector is a component that runs “nearby” (e.g. in the same VPC, AZ, etc.) a user’s application components and receives trace spans and metrics emitted by the tasks instrumented with tracing libraries or agents.
Hypertrace Collector writes spans from this processes/services to Kafka and then will be processed further by Hypertrace ingestion pipeline. Different tracers can have different span formats and as we support tracers like zipkin and jaeger the spans coming via hypertrace-collector to kafka can have different fields in them. span-normalizer reads spans from kafka and adds more first class fields to span object like http url, http method, http status code, grpc method, grpc status message etc. so that platform downstream can access the values from the span. We call this normalized span raw-span which will be further processed by raw-spans-grouper. You can find the first class fields here.
raw-spans-grouper fetches this raw-spans from kafka and creates structured traces out of it based on the trace id and the parent span id in the spans. So from this point onward we have traces and not spans!
So suppose we have two spans with traceID:1234 then we will group them into a single trace.
Trace-enrichers are being used to enrich traces with entity information. hypertrace-trace-enricher service talks to entity-service which fetches entity information from document store (currently we support mongo and postgres as document store and you can configure it in helm as well docker-compose setup) as required and if we don't have entity, it will be created by hypertrace-trace-enricher. For example, Let's say we got a span which has http method related attribute method: /api/v1/user?name. So, in this case, if we already have Endpoint entity which refers to /api/v1/user, we fetch the id of that entity and add it to span. Now, span will have one more attribute like this method:/api/v1/user?name, api_id:1234.
In parallel we have Hypertrace view creator running which is a bootstrap job that runs once and creates required views in pinot - spanEventView, serviceCallView, backendEntityView, rawServiceView, rawTraceView.
Once these views are there in pinot, hypertrace-view-generator consumes enriched traces produced by Hypertrace trace enricher from kafka, applies required filters, transformations and then materializes them into pinot views.
This was whole backend process going on which got our data ready but let's see how query architecture is working which will serve user.
hypertrace-UI talks to hypertrace-GraphQL service which serves the GraphQL API which queries data from downstream services. GraphQL services talks to different grpc services to form the response.
Attribute service fetches all attributes relevant to the scope of what is being shown on UI from document store, where it also stores attributes. All of this metadata assists the UI and backend to perform things in a generic fashion, like
- All String attributes in the UI can have a different look and feel and also different operations that can be supported on them(in the explorer).
- The backend also uses part of the information(like the sources) to figure out where to fetch data from i.e. query-service vs entity-service.
While hypertrace offers a simple service model, it also permits storing certain fields in different backends. Attributes include tags to help locate the service hosting their corresponding data.
Ex.
key: apiName,
value_kind: TYPE_STRING,
groupable : true,
display_name: Endpoint Name,
scope: API_TRACE,
sources: [QS],
type: ATTRIBUTE
For example, apiName is generated from raw trace data streams. sources: [QS] communicates this, as Query Service is the api that queries that data (via Pinot).
Gateway service routes queries to corresponding downstream service based on the source of attributes and then does appropriate type conversion of data returned by downstream services. Gateway service talks to Attribute service to find where to forward the request. Here Query service interfares with Apache Pinot datastore Whereas Entity service here provides CRUD operations for raw or enriched entities, for its types, and their relations.
So if we query UI to search for trace with particular traceID using query like below
curl -s localhost:2020/graphql -H 'Content-Type: application/graphql' -d \
'{
  traces(
    type: API_TRACE
    between: {
      startTime: "2015-01-01T00:00:00.000Z"
      endTime: "2025-01-01T00:00:00.000Z"
    }
    filterBy: [
      {
        operator: EQUALS
        value: "348bae39282251a5"
        type: ID
        idType: API_TRACE
      }
    ]
  ) {
    total
  }
}'
What it will do is it will send this to Gateway service which will forward this to query service and Query service will check if this traceID is present in rawTraceView if it's there it will return 1 or will return 0.
Recently added config service is a place to store configuration data such as user preferences, saved query filters, ingestion config, etc. Many of these use cases have not yet been built out. In general, this service is meant for user-managed configuration that needs to be persisted, and contains support for version history, auditing etc. In the past, we've addressed such things by spinning up individual services (such as attribute service). As new features get built out, we want to avoid that (and eventually to merge older services back into this).
Hypertrace-data-config-service, is designed to be a single macro-service, with separate modules defining different GRPC services that expose feature-specific APIs whereas Hypertrace-data-query-service, is another macro-service that interferes with Pinot to fetch the data. The query and config logical group separation you see in the architecture is a step towards the next iteration of architecture where you will see 3 logical groups namely, ingestion, config, and Query layers.
This was brief about how User side of Hypertrace communicates with Backend i.e. Tracing and data collection side and both work in sync to provide great insights into the application for users!
Here are the articles in this section: